Tropical Cyclones

What is a tropical cyclone?
Image result for parts of a tropical cycloneA tropical cyclone is term used to identify cyclones that originate over the tropical oceans, with an intense low pressure area or a whirl in the atmosphere with organized convection (i.e. thunderstorm activity) and winds at low levels, circulating either anti-clockwise (in the northern hemisphere) or clockwise (in the southern hemisphere). It is also known by other names such as tropical depression, tropical storms, hurricanes, and typhoons. Fully mature tropical cyclones range in diameter from 100 to well over 1000 km. The cloud and rain patterns vary from storm to storm, but in general there are spiral bands in the outer vortex, while the most intense rain and winds occur in the eyewall.
l
l
Categorization/Classification of tropical cyclones
Cyclones are categorized according to wind speeds and the damage they cause.

Category

Damage


Category 1

Wind speeds between 90 and 125 kilometers per hour, some noticeable damage to houses and trees.


Category 2

Wind speeds between 125 and 164 kilometers per hour, damage to houses and significant damage to crops and trees.


Category 3

Wind speeds between 165-224 kilometers per hour, structural damage to houses, extensive damage to crops and uprooted trees, upturned vehicles and destruction of buildings.


Category 4

Wind speeds between 225 and 279 kilometers per hour, power failure and much damage to cities and villages.


Category 5

Wind speeds over 280 kilometers per hour, widespread damage.


By international agreement, tropical cyclones have been classified according to their intensity as follows:

  1. tropical depression, with winds up to 17 m s-1 (34 knots)
  2. tropical storm, with winds of 18–32 m s-1(35–64 knots)
  3. severe tropical cyclone, hurricane or typhoon, with winds of 33 m s-1 (65 knots) or higher.
The wind speeds referred to above are 10-min average wind speeds, except that in the United States were 1-min average wind speeds are used.
Image result for tropical cyclone prepare
l
l
l
Where are tropical cyclones located?
Tropical cyclones are experienced in several areas of the world. In general, they form over the tropical oceans (except the South Atlantic and the eastern South Pacific) and affect the eastern and equatorward portions of the continents. They occur in the tropical North Atlantic (including the Caribbean Sea and Gulf of Mexico), the North Pacific off the west coast of Mexico and occasionally as far west as Hawaii, the western North Pacific (including the Philippine Islands and the China Sea), the Bay of Bengal and the Arabian Sea, the southern Indian Ocean off the coasts of Madagascar and the northwest coast of Australia, and the South Pacific Ocean from the east coast of Australia to about 140°W.
Image result for tropical cyclone
l
l
l
Naming a tropical cyclone
NOAA’s National Hurricane Center does not control the naming of tropical storms. Instead, there is a strict procedure established by the World Meteorological Organization. For Atlantic hurricanes, there is a list of male and female names which are used on a six-year rotation. The only time that there is a change is if a storm is so deadly or costly that the future use of its name on a different storm would be inappropriate. In the event that more than twenty-one named tropical cyclones occur in a season, any additional storms will take names from the Greek alphabet.l
Image result for tropical cyclone
l
l
l
10 Deadliest Storms in U.S. History

Name

Category Year Location Death Toll


Galveston Hurricane

4 1900 Texas

8,000-12,000


Okeechobee Hurricane

4 1928 Florida

2,500-3,000


Katrina

3 2005 Louisiana & Mississippi

1,200


Cheniere Caminada Hurricane

4 1893 Louisiana

1,100-2,000


Sea Islands Hurricane

3 1893 Georgia & South Carolina

1,000-2,000


Georgia-South Carolina Hurricane

2 1881 Georgia & South Carolina

700


Atlantic-Gulf Hurricane

4 1919 Florida & Texas

600-900


New England Hurricane

3 1938 New York & Connecticut

600


Audrey

4 1957 Texas & Louisiana

416


Florida Keys Hurricane 5 1935 Florida

408

Image result for tropical cyclonel
l
Why is this important?
 As global climate change continues to increase in severity, the associated extreme weather will continue to occur at an increased rate. This week’s topic of tropical cyclones is probably the only extreme weather event that I have covered, that has any sort of personal impact. I had previously been married, for what now seems like a lifetime ago. The marriage may not have lasted, but it did give me my wonderful son who is currently 9 years old. Why these tropical cyclones matter to me, is my ex-husband’s family all resides in Florida, an area that is commonly affected by tropical cyclones. His family, especially his parents (my son’s grandparents), play an active role in his life, at least as much as they can since we live in Pennsylvania. Every summer my son will even spend  time with them, as they love him dearly. Anytime that a tropical cyclone is expected to make landfall with Florida, I worry about what will happen to them. I listen to weather reports, and end up searching out any information related to what will happen. They live in an area that could be changed in an instant. I don’t want them to ever or be injured or worse. I would also hope that the family and the environment my son has come to expect and enjoy down there would remain the same. He should not have to worry about tropical cyclones or about what in Florida will change. So for everyone who has family in an area affected by extreme weather, I hope my blog will help you to better understand what is happening and how it could impact their health. The most important thing is for our loved ones to continue to live a long life.
l
l
Disease and Symptoms

There are several diseases and symptoms that people can feel as a result of a tropical cyclone. Below is a list of several of these diseases and symptoms.

  • Stress/mental health
  • Diarrhea
  • Leptospirosis
  • Melioidosis
  • Foodborne disease
  • Waterborne disease
  • Respiratory disease
  • Gastrointestinal disease
Image result for tropical cyclonel
l
Preparing for a Tropical Cyclone
Below is a list of several things that can be done before a tropical cyclone makes landfall.
  • Monitor the news for weather updates, warnings, and advisories.
  • Know the early warning and evacuation plan of the community.
  • Check the integrity of your house and repair weak parts.
  • Prepare your family’s GO BAG containing items needed for survival (like canned food, drinking water, and first aid kit).
  • Put livestock and pets in safe area or designated evacuation site for animals.
  • When notified, immediately go to the designated evacuation center.
  • Install shutters or metal screens on windows and doors.
  • Trim branches away from roof and house.
  • Restrain outdoor objects that may become flying debris.
  • Clean out gutters and downpipes of debris and leaves.
 l
l
l
l“The big lesson I learned from hurricane Katrina is that we have to be thinking about the unthinkable because sometimes the unthinkable happens.”

                                                                                 -Mike Leavitt

l


Closing Remarks

Thank you for visiting my second blog post. I hope that you have found this post to informative and maybe even got you thinking about how many different may be connected. I would love to hear everyone’s thoughts and opinions, so feel free to leave a comment.

l

l

Credit that is Due

Credit should always be given when and wherever it is due. The following sources were used in order to compose this blog entry.

Cdc.gov. (2018). [online] Available at: https://www.cdc.gov/disasters/2017_hurricane_keymessages/docs/CDC-Hurricane-Key-Messages.pdf [Accessed 23 Apr. 2018].

Cyclone, O. (2018). Our guide to preparing for a cyclone | QBE. [online] Qbe.com.au. Available at: https://www.qbe.com.au/news/catastrophe/our-guide-to-preparing-for-a-cyclone [Accessed 23 Apr. 2018].

Glossary.ametsoc.org. (2018). Tropical cyclone – AMS Glossary. [online] Available at: http://glossary.ametsoc.org/wiki/Tropical_cyclone [Accessed 23 Apr. 2018].

Mapsofindia.com. (2018). What are Cyclones – causes and Consequences of Cyclones | My India. [online] Available at: https://www.mapsofindia.com/my-india/india/what-are-cyclones-types-causes-and-effects [Accessed 23 Apr. 2018].

Oceanservice.noaa.gov. (2018). Why do we name tropical storms and hurricanes?. [online] Available at: https://oceanservice.noaa.gov/facts/storm-names.html [Accessed 23 Apr. 2018].

Twitter. (2018). Civil Defense PH on Twitter. [online] Available at: https://twitter.com/civildefensePH/status/946654889345671170 [Accessed 23 Apr. 2018].

Wildfires

Image result for wildfiresA wildfire is a fire that is burning in a natural area of vegetation. They can occur anywhere, and can destroy homes, businesses, infrastructure, natural resources, and agriculture. They have been known to even cause death or injury to people and animals alike. The impact of a wildfire in not strictly related to the area being burned. Embers and smoke are capable of traveling far distances, and creating difficulties are people with respiratory health conditions.


Image result for worst wildfire

Image result for smokey bear


Causes

  • lightning
  • cigarettes/smoking
  • campfires
  • arson (intentional outdoor burning)
  • debris burn
  • equipment
  • children
  • railroad
  • power lines
  • fireworks


Image result for worst wildfire


The 10 Worst States for the Occurrence of Wildfires

State

Area burned, wildfires   2007-2016 Wildfire damage   2007-2016 (acres) 2016 Wildfires Planned burns      2007-2016 (acres)

Large (100k+ acre) fires since 1997


Idaho


13.0%


6,892,160


630


385,993


27


Oregon


7.8%


4,761,511


1,245


939,375


15


California


6.6%


6,561,354


7,349


620,750


17


Washington


6.5%


2,744,221


1,272


159,891


9


Oklahoma


4.7%


2,084,297


1,938


70,816


3


Florida


4.6%


1,583,756


3,067


3,409,901


1


New Mexico


4.4%


3,400,843


1,240


699,581


4


Texas


3.7%


6,155,675


9,300


1,131,512


10


Nevada


3.7%


2,586,669


467


56,942


17


Arizona


3.5%


2,537,948


2,288


921,424


5


Image result for worst wildfire


Climate Change and Wildfires

The image to the left illustrates the number of acres that have been burned in Western forest fires from 1984 to 2015. The picture may make the information easier to understand than by being provided numbers and statistics. It is important to note that 44% of 10.4 million has been burned because of global warming.


Image result for worst wildfire


Wildfires and climate change.


Please visit  is global warming fueling increased wildfire risks for more information regarding the topic.


Image result for worst wildfire


What can I do?

  1. Check current pollution levels, and monitor the air quality.
  2. Do not burn any wood or trash.
  3. Improve the indoor air quality by installing an air purifier.
  4. Install smoke detectors on every level within a home.
  5. Have a planned escape route.
  6. During a wildfire, listen for emergency information.
  7. Limit vigorous activity and long periods of time outdoors (especially during a wildfire).
  8. Check on your neighbors.
  9. Keep your car fueled, in good condition, and stocked with emergency supplies and a change of clothes.


Image result for worst wildfire


The 5 P’s of Evacuation

  1. People
    • people and, if safely possible, pets and other animals/livestock
  2. PrescriptionsImage result for 5 p's
    • prescriptions with dosages
    • medicines
    • medical equipment
    • batteries or power cords
    • eyeglasses
    • hearing aides
  3. Papers
    • papers, including important documents
  4. Personal Needs
    • clothes
    • food
    • water
    • first aid kit
    • cash
    • phones
    • chargers
    • and items for people with disabilities and/or other functional needs
  5. Priceless Items
    • pictures
    • irreplaceable mementos
    • valuables


Why is this important?

It seems like every year that wildfires have been mentioned by the news stations in some way (at least within the United States). It has become a common occurrence for the people who live in areas that are plagued so frequently by them. It is important to be aware of how it not only affects the people within the vicinity of the fire, but also those who are thousands of miles away. My goal is to let people be aware of wildfires, and the possible medical implications of them. I hope that with this blog post, that people can take any necessary precautions to avoid needing medical attention and stay healthy for as long as possible. In this day and age, it is always amazes me that people are living healthier and longer than ever before. I would especially like for the people in the wildfire prone areas to be well informed, and live their healthy lives for years and years to come.


Image result for worst wildfire


Diseases and injuries

There are several signs and symptoms that people can feel as a result of a wildfire. Below is a list of several of the signs and symptoms.

  • burns
  • cough
  • wheezing
  • shortness of breath
  • sore throat
  • headache
  • burning or stinging of the eyes, nose, or throat
  • dizziness
  • lightheadedness
  • dehydration


Image result for worst wildfire


The predisposed

Predisposed Category

Potential Effects due to smoke exposure

Persons with asthma

Picture

·         More frequent & more severe asthma attacks

Chronic Heart or Lung Disease

Picture

·         Shortness of breath

·         COPD (Chronic Obstructive Pulmonary Disease)

·         Chest tightness

·         Pain in chest, neck, shoulder, or arm

·         Heart palpitations

·         Unusual fatigue or lightheadedness

Adults ≥ 65 years of age

Picture

·         Increased Susceptibility to bacterial or viral infections because of compromised immune system

Circulatory System Disease

Picture

·         Temporary chest pain

·         Heart attacks

·         Cardiac arrhythmias

·         Stroke

·         Acute CHF (Congestive Heart Failure)

Pregnant woman

Picture

·         Damage to the developing lungs of the fetus

Infants and children

Picture

·         Risk of damage to lungs, which are still developing

·         Kids are more likely to be active when outdoors- running, playing, being kids- meaning they typically inhale more harmful chemicals per pound of body weight

Disclaimer: I will like to mention that the predisposition is not for everyone under those categories. There are some people who may be under a certain category, but do not show any of the typical characteristics


When to seek medical attention

Certain factors can affect when a person should seek medical care. A few examples of these would be age, current diseases or disorders, other health issues, or symptoms that the person may be displaying. More important than anything else, is to listen to your body. You know it better than anyone else, and can tell when something is not right. If experiencing any of the following signs or symptoms, please seek medical attention as soon as possible:

  • a cough that is persistent or worsening
  • shortness of breath, beyond what is usually experienced
  • chest pain or tightness
  • significant weakness or fatigue


Image result for worst wildfire


To stay informed about the current fire conditions and how it will effect the air quality, please visit https://airnow.gov/index.cfm?action=topics.smoke_wildfires.

Image result for wildfire health effects


          “The wildfire and its habitat cannot speak, so we must and we will.”

                                                                                        -Theodore Roosevelt


Closing Remarks

Thank you for visiting my second blog post. I hope that you have found this post to informative and maybe even got you thinking about how many different may be connected. I would love to hear everyone’s thoughts and opinions, so feel free to leave a comment.


Credit that is Due

Credit should always be given when and wherever it is due. The following sources were used in order to compose this blog entry.

Airnow.gov. (2018). Fires: Current Conditions. [online] Available at: https://airnow.gov/index.cfm?action=topics.smoke_wildfires [Accessed 3 Apr. 2018].

Children’s, C. (2018). Minimizing Health Effects of Wildfires. [online] CHOC Children’s Blog. Available at: https://blog.chocchildrens.org/minimizing-health-effects-wildfires/ [Accessed 3 Apr. 2018].

Climate Smart Missoula. (2018). Wildfire Smoke. [online] Available at: https://www.missoulaclimate.org/wildfire-smoke.html [Accessed 7 Apr. 2018].

Fema.gov. (2018). [online] Available at: https://www.fema.gov/media-library-data/1409003859391-0e8ad1ed42c129f11fbc23d008d1ee85/how_to_prepare_wildfire_033014_508.pdf [Accessed 3 Apr. 2018].

Gordonwi.us. (2018). Brule-St. Croix Community Wildfire Protection Plan, CWPP, Wascott, Gordon, Highland, Solon Springs, Wisconsin, Douglas County. [online] Available at: http://www.gordonwi.us/Firewise/fire-updates.html [Accessed 3 Apr. 2018].

MedicineNet. (2018). Protect Yourself from Wildfire Smoke by MedicineNet.com. [online] Available at: https://www.medicinenet.com/script/main/art.asp?articlekey=54382 [Accessed 3 Apr. 2018].

Missoulaclimate.org. (2018). [online] Available at: https://www.missoulaclimate.org/uploads/4/3/2/6/43267085/wildfires_and_your_health_infographics.png [Accessed 3 Apr. 2018].

Oregon.gov. (2018). Oregon Health Authority : Wildfires and Smoke : Get Prepared : State of Oregon. [online] Available at: http://www.oregon.gov/oha/PH/Preparedness/Prepare/Pages/PrepareForWildfire.aspx [Accessed 7 Apr. 2018].

Province of Manitoba – Manitoba Health, Seniors and Active Living. (2018). Health Effects of Smoke Exposure due to Wildland Fires | Province of Manitoba. [online] Available at: https://www.gov.mb.ca/health/publichealth/environmentalhealth/smoke.html [Accessed 7 Apr. 2018].

Ready.gov. (2018). Wildfires | Ready.gov. [online] Available at: https://www.ready.gov/wildfires [Accessed 3 Apr. 2018].

Sauter, M. (2018). States Where Wildfires Caused the Most Damage. [online] 247wallst.com. Available at: https://247wallst.com/special-report/2017/05/10/states-with-the-most-wildfires/10/ [Accessed 3 Apr. 2018].

Snohomishcountywa.gov. (2018). Wildfire Preparedness | Snohomish County, WA – Official Website. [online] Available at: https://snohomishcountywa.gov/3629/Wildfire-Preparedness [Accessed 3 Apr. 2018].

Townofwascott.org. (2018). Index of /CWPP. [online] Available at: http://www.townofwascott.org/CWPP/ [Accessed 3 Apr. 2018].

Union of Concerned Scientists. (2018). Infographic: Western Wildfires and Climate Change. [online] Available at: https://www.ucsusa.org/global-warming/science-and-impacts/impacts/infographic-wildfires-climate-change.html#.Wr8j6S7waM8 [Accessed 3 Apr. 2018].

Union of Concerned Scientists. (2018). Is Global Warming Fueling Increased Wildfire Risks?. [online] Available at: https://www.ucsusa.org/global-warming/science-and-impacts/impacts/global-warming-and-wildfire.html#.Wr8j5y7waM8 [Accessed 3 Apr. 2018].


Floods


Related image
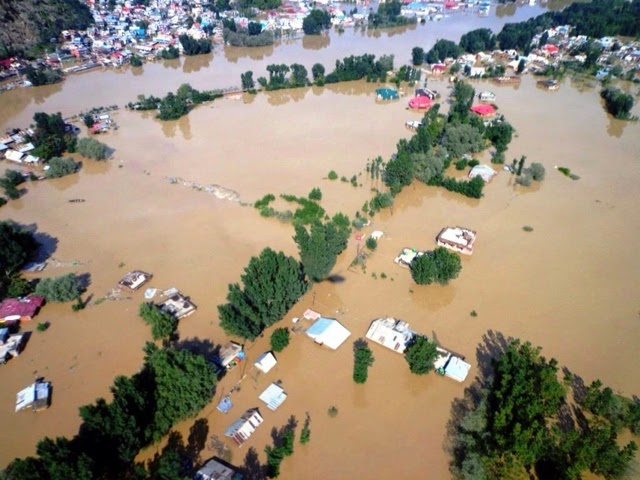
According to the American Meteorological Society (AMS), a flood is defined as the overflowing of the normal confines of a stream or other body of water, or the accumulation of water over areas that are not normally submerged. Although flooding in not a new concept, they are another example of an extreme event that has been affected by climate change. As climate change keeps on occurring, the frequency and intensity of the flooding episodes will continue to rise. This can then lead to various health implications for many of the world’s population.


PPThere are several different possible things that may contribute to the formation of a flood. Some of the possible ways are provided in the list Image result for causes of floodsbelow, but they are also in no way inclusive of all of the possible contributing factors.
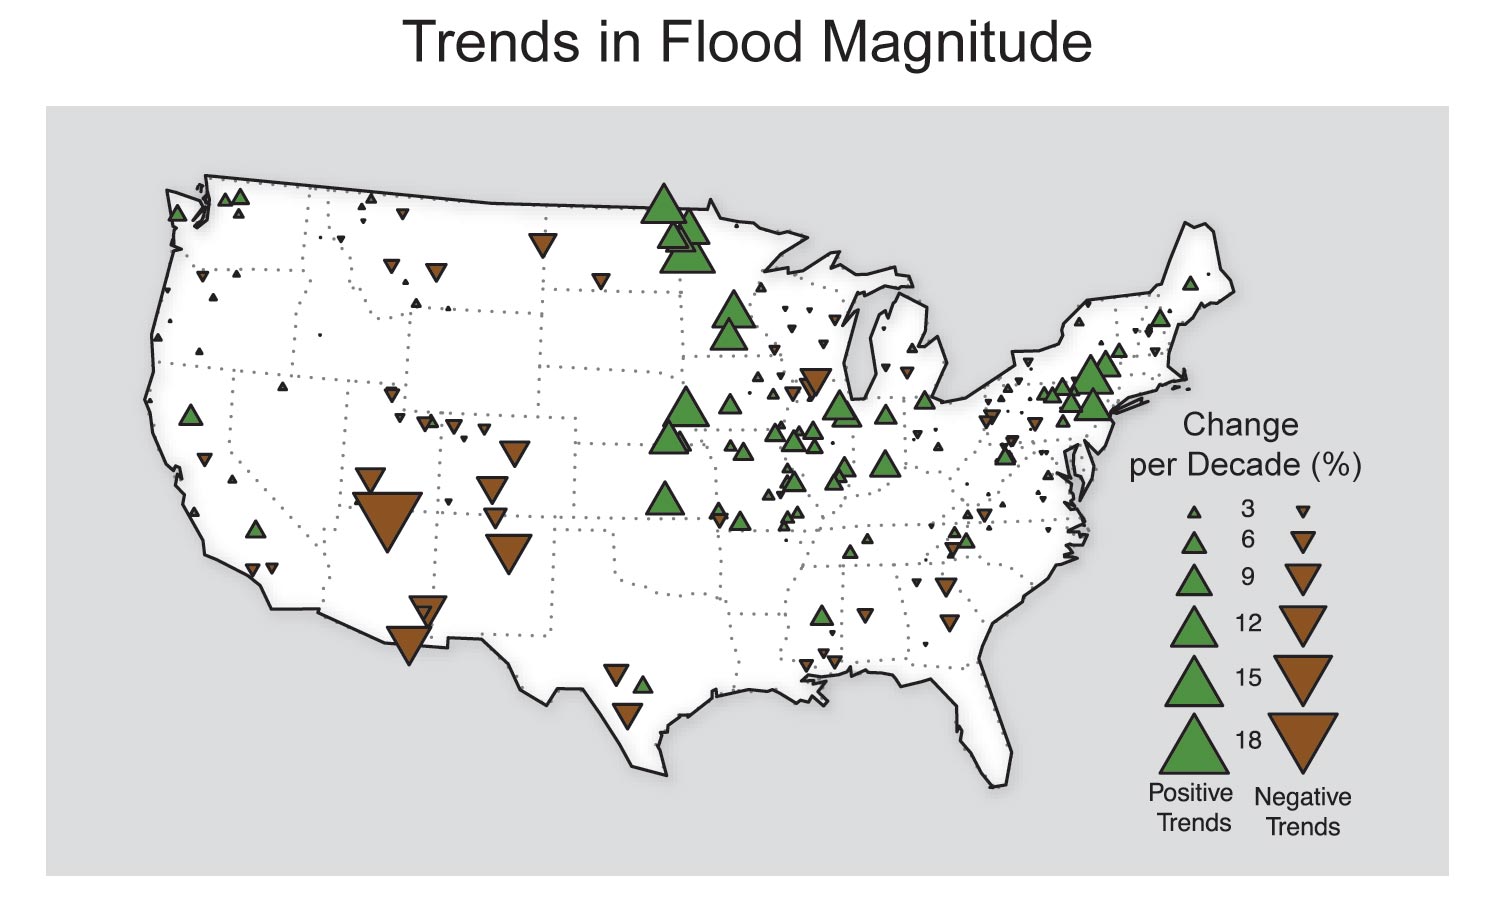
  • Urban drainage basins
  • Deforestation
  • Intense precipitation
  • Snow melt or ice thaw
  • Storm Surge
  • Landslide
  • Impacts of enhanced greenhouse effects
  • Overflowing rivers
  • Lack of vegetation


Trends in Flood MagnitudeThe map that is shown to the left illustrates the trends in the magnitude of river flooding throughout the United States. The river flood magnitudes occur from the 1920s through 2008. The Southwest has decreased in magnitude while  the eastern Great Plains, parts of the Midwest, and from the northern Appalachians into New England have increased in magnitude. The decreasing trends are displayed in brown while the increasing trends are displayed in green. Size of the triangles show the magnitude of the trends.


Frequency of Flooding Along U.S. Coasts, 2010–2015 Versus 1950–1959

Map with bar graphs showing changes in the frequency of flooding along the U.S. coastline between the 1950s and 2010s. The map that is shown above of the United States illustrates how coastal flooding has changed over time. The map shows the average number of days per year in which coastal waters rose above the local threshold for minor flooding at 27 sites along U.S. coasts. Each small bar graph compares the first decade of widespread measurements (the 1950s in orange) with the most recent decade (the 2010s in purple).


Worst Floods in the United States

Rank Flood Name State(s) Year Casualties
1 Johnston Pennsylvania 1889 2209
2 St. Francis Dam Failure California 1928 431
3 Ohio River Flood of 1937 Pennsylvania, Ohio, West Virginia, Kentucky, Indiana, Illinois 1937 385
4 Great Dayton Flood Ohio 1913 360
5 Great Mississippi Flood of 1927 Arkansas, Illinois, Kentucky, Louisiana, Mississippi, Missouri, Tennessee, Texas, Oklahoma, Kansas 1927 246
6 Black Hills Flood South Dakota 1972 238
7 Los Angeles Flood of 1938 California 1938 115
8 Columbus, Ohio flood on March 25, 1913 Ohio 1913 90
9 Failure of Laurel Run Dam and flash flooding Pennsylvania 1977 80
10 Austin Dam Failure Texas 1911 78

The table above was included to demonstrate that floods are not just something that happens in third world countries. The table above illustrates the 10 worst floods of the United States. Home were damaged and lives have been lost. The main cause of these floods may be due to the failure of dams, but in the end it is still a flood. They have forever impacted the lives of many people.


Why does this matter?

Before I go into discussing about the diseases and injuries that can be contributed to the occurrence of a flood, I wanted to talk a little bit more about why this matters. I was recently asked why would anyone care about flooding and the possible health implications. Why do I care about it? I personally have not experienced a flood, due to living in the same house practically all of my life. However, I do believe that being in the medical industry is not just about helping yourself. A large portion of it involves helping others, especially whenever they may be at their worst. The extreme weather events like flooding, can lead to an increase in health problem for the world. If my blog is able to help even just one person, even it just provides a little more information to help them prevent an illness or injury, then I believe I had succeeded with this blog. My main goal is to just help the world in some way, regardless of who is being helped.


Diseases and Injuries

Like with any weather event, there are certain diseases that are more frequently observed during a flood. Provided Image result for diseasesbelow is a general list of some of the diseases or injuries that people can contract.

  • water-borne infections
    • Cryptosporidiosis
    • Escherichia coli infection
    • Giardiasis
    • Harmful Algal Blooms
    • Legionellosis
    • Naegleria and Amebic Meningoencephalitis
    • Norovirus infection
    • Shingellosis
    • Swimmer’s Ear
    • Swimmer’s Itch
  • vector-borne infections (mostly transmitted by the mosquito)
    • West Nile Virus
    • La Crosse Encephalitis (LAC)
    • Jamestown Canyon Virus (JCV)
    • Western Equine Encephalitis (WEE)
    • Eastern Equine Encephalitis (EEE)
    • St. Louis Encephalitis (SLE)
    • Zika
    • Yellow Fever
  • stress/mental health
  • toxic pollutant exposure
  • drowning
  • airborne viruses
  • dermatitis
  • hypothermia
  • gastrointestinal illness
  • snake bites
  • trench foot


Flooded City Streets

File:Post flood health.jpg

Only whenever it is an absolute necessity, should anyone move around in flood waters. The waters can hide a multitude of hazards that may not be visible to the naked eye. As depicted in the poster to the left (which was created by the Centers for Disease Control and Prevention), hazards make lurk in the air, floating on the water, dissolved within the water, and under the water (possibly on the ground itself).


14 tips to avoid health hazards caused by a flood

Image result for health tipsBefore and after a flood has occurred, it is more important than ever to be cautious with our actions, as well as with what people are consuming. A list of health tips to follow has been created, in order to prevent any illness or injury that may happen as a result of a flood.

  1. Make sure drinking water is from a safe source.
  2. Cook food well, dispose food waste properly.
  3. Always wash your hands before eating and after using the toilet.
  4. Clear stagnant water in and around the house to prevent mosquito breeding sites.
  5. Do not allow children or pets to wade in floodwaters to avoid diseases.
  6. Clean up your surroundings and destroy mosquito breeding sites.
  7. Throw out any food that has come into contact with floodwaters, and any food that has perished.
  8. Avoid well water due to possible contamination.
  9. Use mosquito repellents to prevent possible illnesses.
  10. Bathe on a regular basis.
  11. Cover any possible open wounds.
  12. Ensure that vaccinations are up to date.
  13. Do not touch any exposed or open wires.
  14. Don’t use food that’s been standing for 2 hours.


Please visit  health risks of flooding in a warming world for more information regarding the topic


“I believe climate change is the defining environmental issue of our time. It’s hurting our people — around the world — and it’s time to stand up and say we’ve had enough. Enough of rising seas and widening deserts that threaten our homes and our crops. Enough of withering drought and blistering heat that mean more malnutrition and disease. Enough of raging floods, wildfires and storms that threaten people everywhere with one disaster after another.”

                                                                                 -Robert Redford


Closing Remarks

Thank you for visiting my second blog post. I hope that you have found this post to informative and maybe even got you thinking about how many different may be connected. I would love to hear everyone’s thoughts and opinions, so feel free to leave a comment.


Credit that is Due

Credit should always be given when and wherever it is due. The following sources were used in order to compose this blog entry.


B-Air Blowers, Air Movers & Dehumidifiers | Commercial Equipment. (2018). What Causes Floods? | The 8 Most Common Causes of Flooding. [online]  Available at: https://b-air.com/2018/02/common-causes-flooding/ [Accessed 28 Mar. 2018].

Fluvial-innovations.co.uk. (2018). Flood infographic: types, causes and cost of flooding. [online] Available at: https://www.fluvial-innovations.co.uk/2016/12/22/flood-infographic-types-causes-cost/ [Accessed 28 Mar. 2018].

Glossary.ametsoc.org. (2018). Flood – AMS Glossary. [online] Available at: http://glossary.ametsoc.org/wiki/Flood [Accessed 28 Mar. 2018].

Health.state.mn.us. (2018). Causes and Symptoms of Waterborne Illness – Minnesota Dept. of Health. [online] Available at: http://www.health.state.mn.us/divs/idepc/dtopics/waterborne/basics.html [Accessed 28 Mar. 2018].

Health.state.mn.us. (2018). Diseases that can be Transmitted by Mosquitoes – Minnesota Dept. of Health. [online] Available at: http://www.health.state.mn.us/divs/idepc/dtopics/mosquitoborne/diseases.html [Accessed 28 Mar. 2018].

Kiprop, J. (2018). The Worst Floods in US History. [online] WorldAtlas. Available at: https://www.worldatlas.com/articles/the-worst-floods-in-us-history.html [Accessed 29 Mar. 2018].

National Climate Assessment. (2018). Extreme Weather. [online] Available at: https://nca2014.globalchange.gov/highlights/report-findings/extreme-weather [Accessed 28 Mar. 2018].

TamilNadu Private Buses. (2018). Chennai Rains – Top Dos and Don’ts for Chennaites to Stay Healthy.. [online] Available at: https://tamilnaduprivatebuses.wordpress.com/2015/12/06/chennai-rains-top-dos-and-donts-for-chennaites-to-stay-healthy/ [Accessed 28 Mar. 2018].

Union of Concerned Scientists. (2018). Climate Change and Your Health: Global Warming May Increase Flooding, Threaten Our Health (2012). [online] Available at: https://www.ucsusa.org/global_warming/science_and_impacts/impacts/global-warming-and-flooding.html#.Wrvc7XrwbIU [Accessed 28 Mar. 2018].

US EPA. (2018). Climate Change Indicators: Coastal Flooding | US EPA. [online] Available at: https://www.epa.gov/climate-indicators/climate-change-indicators-coastal-flooding [Accessed 28 Mar. 2018].

World Health Organization. (2018). Infographics: Health tips after natural disasters. [online] Available at: http://www.who.int/mediacentre/infographic/hurricanes/en/ [Accessed 28 Mar. 2018].


Droughts


Image result for drought

A drought is considered to be an extended period of time with little to no precipitation for a region. So depending on the region, depends on what constitutes a drought. A drought in somewhere like New York would be very different than a drought in Arizona. The lack of precipitation can be accompanied with high temperatures. Droughts can be divided into four different categories: meteorological, agricultural, hydrological, and socioeconomic. Below you will see a table that gives a brief description of each type.

Category

Description

Meteorological

Image result for precipitation


  • Is specific for the region.

  • Focuses on the amount of precipitation received.

Agricultural

Image result for agricultural cartoon


  • Accounts for the water needs of crops during different stages.

  • Can be independent from precipitation levels.
  • Focuses on soil conditions and erosion.

Hydrological

Image result for hydrological


  • Persistently low water volumes in streams, rivers and reservoirs.

  • Can be linked with meteorological droughts.
  • Human activities can worsen hydrological droughts (such as drawdown of reservoir).
  • Drought will slowly develop.

Socioeconomic

Image result for socioeconomic


  • Occurs whenever there is a demand of water greater than what is in the supply.

  • May be caused by too much irrigation or low river flow forces hydroelectric plant operators to reduce energy production.


Image result for united states drought monitorTo monitor drought conditions, the United States has their own tool for monitoring the conditions and portraying them to the public. The United States Drought Monitor (USDM) produces a map on a weekly basis that takes in to account the measurements of precipitation, soil moisture, stream flow, and many other variables. The image to the right is an example of the map that is produced. The table below describes how drought severity is calculated and classified.


Image result for drought monitor

For more information, or to view the current USDM map, please go to http://droughtmonitor.unl.edu

For areas not located in the United States, the Global Drought Information System can provide a worldwide map with the drought monitor, or with the standardized precipitation index.


The chart to the left uses the annual Palmer Drought Severity Index values, and averages it over the 48 contiguous states. Positive values indicate conditions that are wetter than average, while negative ones indicate conditions that are dryer than average. A value between -2 and -3 indicates moderate drought, -3 to -4 is severe drought, and -4 or below indicates extreme drought. The thicker line is a nine-year weighted average. This chart has been included to show how drought conditions have changed throughout time.


Image result for signs and symptoms

There are several signs and symptoms that people can feel as a result of the heat or lack of precipitation of a drought. Below is a list of several of the general signs and symptoms.

  • dehydration
  • malnutrition/starvation
  • impaired immune system (leads to increased incidence of infections)
  • diarrhea
  • stress and anxiety
  • fatigue with exertion
  • heat exhaustion
  • heat stroke
  • worsening respiratory conditions


With droughts, there is an increased incidence in diseases and illnesses that are related to the decreased precipitation amounts. Most of the diseases and illness are food-borne diseases, water-borne diseases, related to toxin exposure, or are a result of transmission through mosquitoes, ticks, or other insect. Image result for farmer crops cartoonWhenever there is a lack of water, like during the time of a drought, farmers will occasionally recycle the water to help the food grow. The water which had not been adequately treated can then infect the crops to cause food-borne diseases. This decreased water supply can also lead to an increased use of pesticides, herbicides, and fungicides to decrease weeds and pests. However, as a consequence, the chemicals may also be absorbed into the food we eat, allowing for an increased risk for disease.


Droughts help contribute to an increased concentration of pathogens. Image result for lack of water cartoonThe ratio between the concentration of pathogens and water flow changes. The concentration of pathogens is now higher, while the amount of water flow is lower than usual. The increased concentration may become too overwhelming for some water treatment centers, allowing for some pathogens to contaminate the drinking water. As the level of water decreases, the concentration of sediment and other minerals located at the bottom of the water supply are increased. The various pathogens, sediment, and minerals can prove to be a large concern for those who obtain their drinking water from a private well.


Vector-borne diseases (diseases carried by mosquitoes, ticks, and other insects), did not immediately make sense as to why they might increase during a drought. Image result for vector borne diseases
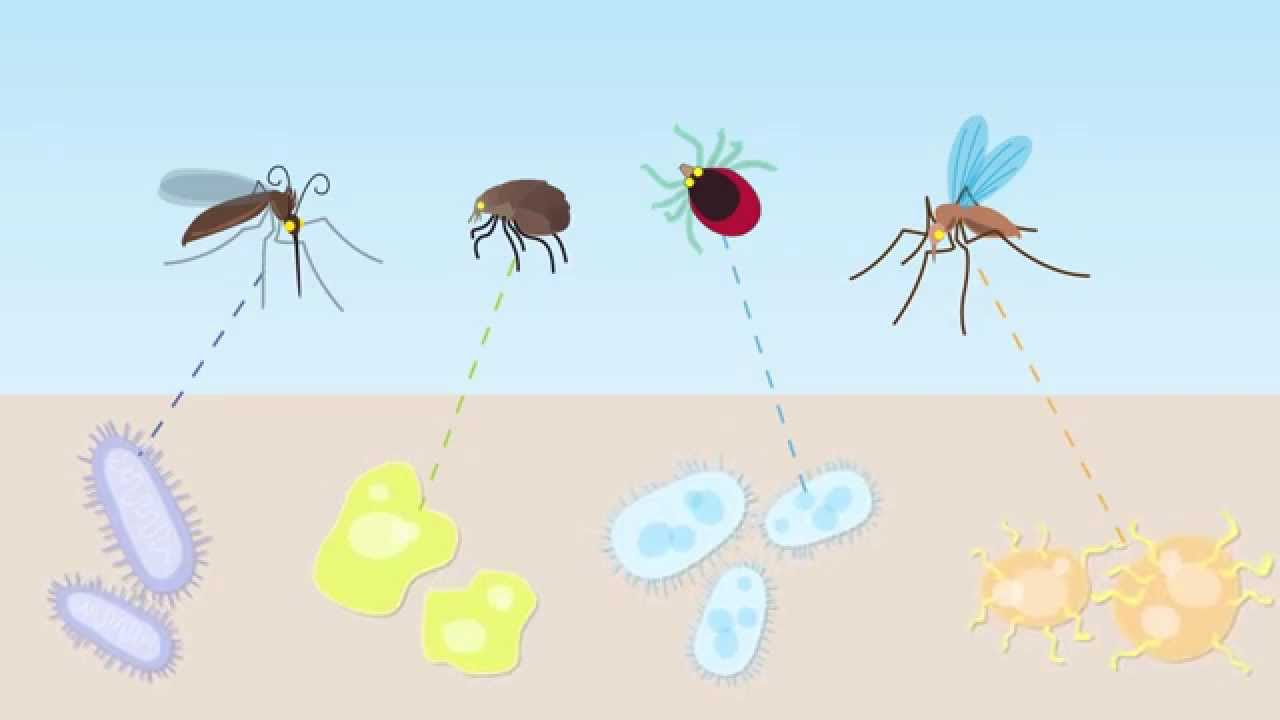
Throughout a drought, there is not much water to be found. This not only affects animals, but humans as well. Because of the lack of water, humans tend to want to store water close to their homes. The increased amount of water in urban areas, draws in the mosquitoes, birds, and other animals. This causes an increase in the number of disease carrying animals. There are now more animals in a closer proximity than they normally would be, which leads to an increase incidence of these diseases. Below is a table displaying a portion of the drought-related illnesses with their associated signs and symptoms.

Disease

Signs and Symptoms

West Nile virus


Headache, body aches, vomiting , diarrhea, rash, fatigue, weakness, joint pain, and neuroinvasive disease (infection and inflammation of the brain)

Valley fever


Fever, cough, shortness of breath, night sweats, headaches, joint pain, muscle aches, rash, and fatigue

E. coli


Stomach cramps, diarrhea, vomiting, and fever

Salmonella


Diarrhea, fever, and abdominal cramps

St. Louis Encephalitis


Fever, headache, dizziness, nausea, malaise, stiff neck, confusion, disorientation, tremors, and unsteadiness

Lyme Disease


Fever, chills, headache, fatigue, muscle aches, joint pain, and rash

Cholera


Diarrhea, vomiting, tachycardia, thirst, muscle cramps, restlessness, irritability, dry mucous membranes, loss of skin elasticity, and hypotension

Malaria


Chills, headache, muscle aches, tiredness, nausea, vomiting, diarrhea, anemia, and jaundice

Primary Amebic Meningoencephalitis (PAM)


Severe frontal headache, fever, nausea, vomiting, stiff neck, seizures, altered mental status, hallucinations, and coma

Dengue Fever


Severe headache, severe eye pain, joint pain, muscle pain, bone pain, rash, mild bleeding manifestations, and low white blood cell count


“Humanity is sitting on a time bomb. If the vast majority of the world’s scientists are right, we have just ten years to avert a major catastrophe that could send our entire planet’s climate system into a tail-spin of epic destruction involving extreme weather, floods, droughts, epidemics and catastrophe of our own making.”

                                                            -Al Gore


Closing Remarks

Thank you for visiting my second blog post. I hope that you have found this post to informative and maybe even got you thinking about how many different may be connected. I would love to hear everyone’s thoughts and opinions, so feel free to leave a comment. 


Credit that is Due

Credit should always be given when and wherever it is due. The following sources were used in order to compose this blog entry.

https://www.cdc.gov/nceh/drought/infectious.htm                                                https://www.cdc.gov/westnile/symptoms/index.html                            https://www.cdc.gov/fungal/diseases/coccidioidomycosis/symptoms.html https://www.cdc.gov/ecoli/ecoli-symptoms.html https://www.cdc.gov/salmonella/typhimurium-cantaloupe-08-12/signs-symptoms.html                                                                                  https://www.cdc.gov/sle/technical/symptoms.html https://www.cdc.gov/ticks/symptoms.html                                                                        https://www.cdc.gov/malaria/about/faqs.html                                                        https://www.cdc.gov/parasites/naegleria/illness.html https://www.cdc.gov/dengue/symptoms/index.html    https://www.cdc.gov/cholera/illness.html                                          https://www.epa.gov/climate-indicators/climate-change-indicators-drought  https://www.livescience.com/21469-drought-definition.html http://droughtmonitor.unl.edu/                                                          https://www.drought.gov/gdm/                  https://cameronwebb.wordpress.com/2015/04/12/why-would-a-californian-drought-trigger-an-outbreak-of-mosquito-borne-disease/ https://www.niehs.nih.gov/research/programs/geh/climatechange/health_impacts/vectorborne/index.cfm https://www.niehs.nih.gov/research/programs/geh/climatechange/health_impacts/waterborne_diseases/index.cfm https://www.niehs.nih.gov/research/programs/geh/climatechange/health_impacts/foodborne_diseases/index.cfm                                                                https://www.popsci.com/severe-west-nile-virus-epidemics-are-more-likely-to-happen-during-droughts

Heat Waves

AR-304059985

As climate change continues to occur and get worse, so do the extreme weather events. One such example of worsening extreme weather, includes heat waves. Heat waves can be defined as a period of abnormally and uncomfortably hot and humid weather that lasts two or more consecutive days. They cause more fatalities than any other single extreme weather event. The fatalities from heat waves will soon increase even more over time. This is due to the fact that climate change will cause the heat waves to grow in intensity, occur over longer periods of time, and occur more frequently. As these weather events become worse, people need to be cautious and plan accordingly to prevent any adverse effects to their health, or to their livelihood.


There are several signs and symptoms that people can feel as a result of the heat or humidity of a heat wave. Below is a list of several of the signs and symptoms.

  • dehydration
  • dizziness
  • fanting
  • rash
  • heat exhaustion
  • heat stroke
  • lower extremity swelling
  • heat cramps


With heat waves, there are many individuals who are at a higher risk to feel its effects than others. It may be dependent on their medical history, socioeconomic status, age, mental capacity, prescribed medication, and the location of where they work. Having a complex medical history does not automatically mean that things will be worse for you. People especially with cardiovascular or respiratory diseases will have greater difficulties in handling the high heat and humidity. In the table below is a list of several of these diseases, as well as a column for some miscellaneous diseases that would not fit under the other two columns.

Cardiovascular

Respiratory

Other

History of angina pectoris Pneumonia Diabetes
Heart failure Influenza Alzheimer’s disease
Cardiac dysrhythmias Chronic Obstructive Pulmonary Disease (COPD) Acute renal failure
Hypertensive disease Asthma Parkinson’s disease
Cardiovascular Accident (aka a stroke) Emphysema History of epilepsy
Diseases involving arteries, arterioles, & capillaries Chronic bronchitis Cirrhosis of the liver


Image result for elderly

The elderly population (anyone at the age of 65 or older), are more susceptible than those in any other age group. Not only do they have an extensive medical history, but they also have an impaired sensation of heat due to their thin, frail skin. Whenever there is extreme heat,  they may not recognize that there is an issue, and may possibly think that it feels completely fine.


Image result for outdoor workers

Outdoor labor workers work outside in the elements, and can be exposed to the harmful effects of a heat wave for several hours. Their jobs require them to exert some level of physical labor to complete their job. They may be required to work at a strenuous pace to complete a necessary quota or deadline. this means they may push themselves do accomplish more than what is considered safe. 


Image result for medication

There are medications that will affect the mechanisms responsible for cooling a body down, or are capable of causing health concerns in another way. There are medication that could alter the thermoregulation (regulation of the body’s temperature), and thus the response or actions associated with it. Some medications will alter an individual’s alertness, which could be just be drowsiness or heat-avoidance behavior. Antihypertensive medications are another medication that may affect how people interpret the effects of a heat wave. It causes vasodilation, which in turn could lead to lightheadedness, dizziness, or fainting. Anticholingeric medications will affect the body’s smooth muscles, and could leave the individual with an impaired sweating mechanism and dry mouth. The increased temperature of a heat wave may also decrease a medication’s effectiveness, or could increase the amount of medication present in the body (i.e. drug toxicity). This especially holds true for medications with a narrow therapeutic range. Regardless of the medication, the people taking them should be aware of these extreme events. They should also follow the safety measures for susceptible people.


Image result for specific heat index NEWS

For the people that were mentioned beforehand, it is especially important to be aware of the weather, so that they may take the necessary precautions. The National Weather Service uses a specific heat index to alert the public of days that pose the biggest threat. With the relative humidity and temperature, it displays what the temperature outdoors will actually feel like. It also displays these temperatures in categories ranging from caution all the way to extreme heat, for the public to understand it better.  The image above shows what this heat index chart looks like. 


Image result for health heat wave


The image to the right describes what the three different heat alerts are, and what the differences are. A heat outlook describes a heat event in 3-7 days. A heat watch describes a heat event in 12-48 hours. Finally, a heat warning/advisory describes a heat event in the next 36 hours. These heat alerts are just another way for the public to be notified and aware of the weather around them.


images (1)

  • Stay hydrated by drinking plenty of fluids
  • Take breaks in the shade whenever possible
  • Use air conditioners to maintain a cool environment indoors
  • Check on the elderly and people who do not own an air conditioner
  • Limit strenuous outdoor activity
  • Wear lightweight, light-colored, and loose-fitting clothing
  • Avoid caffeine and alcoholic drinks
  • Wear sunscreen, a hat, and sunglasses whenever outdoors
  • Schedule outdoor activities during the coolest part of the day
  • Do not leave children in the car
  • Avoid hot and heavy meals


“For the sake of our children and our future, we must do more to combat climate change. Now, it’s true that no single event makes a trend. But the fact is the 12 hottest years on record have all come in the last 15. Heat waves, droughts, wildfires, floods–all are now more frequent and more intense. We can choose to believe that Superstorm Sandy, and the most severe drought in decades, and the worst wildfires some states have ever seen were all just a freak coincidence. Or we can choose to believe in the overwhelming judgement of science–and act before it’s too late.”                                                                                                                                                                                                                                  -Barack Obama


Closing Remarks

Thank you for visiting my second blog post. I hope that you have found this post to informative and maybe even got you thinking about how many different may be connected. I would love to hear everyone’s thoughts and opinions, so feel free to leave a comment. 


Credit that is Due

Credit should always be given when and wherever it is due. The following sources were used in order to compose this blog entry.


Cdc.gov. (2018). Tips for Preventing Heat-Related Illness|Extreme Heat. [online] Available at: https://www.cdc.gov/disasters/extremeheat/heattips.html [Accessed 27 Feb. 2018].

Davis, R. E., P. C. Knappenberger, P. J. Michaels, and W. M. Novicoff, 2003: Changing Heat-  Related Mortality in the United States. Environmental Health Perspectives, 111, 1712-1718, doi: 10.1289/ehp.6336.

Nws.noaa.gov. (2018). NWS Heat Safety Tips. [online] Available at: http://www.nws.noaa.gov/os/heat/ [Accessed 27 Feb. 2018].

Penn State Health News. (2018). The Medical Minute: Tips for weathering a heat wave. [online] Available at: https://pennstatehealthnews.org/2013/07/the-medical-minute-tips-for-weathering-a-heat-wave/ [Accessed 27 Feb. 2018].

Robinson, P. J., 2000: On the Definition of a Heat Wave. J. Appl. Meteor. Climatol., 40, 762-775, https://doi.org/10.1175/1520-0450(2001)040%3C0762:OTDOAH%3E2.0.CO;2.

Semenza, J. C., J. E. McCullough, W. D. Flanders, M. A. McGeehin, and J. R. Lumpkin, 1999: Excess Hospital Admissions During the July 1995 Heat Wave in Chicago. American Journal of Preventative Medicine, 16, 269-277, https://doi.org/10.1016/S0749-3797(99)00025-2.

Tan, J., 2008: Commentary: People’s vulnerability to heat wave. International Journal of Epidemiology, 37, 318-320, doi: 10.1093/ije/dyn023.

Who.int. (2018). WHO | Heatwaves and health: guidance on warning-system development. [online] Available at: http://www.who.int/globalchange/publications/heatwaves-health-guidance/en/ [Accessed 27 Feb. 2018].

Air Pollution

      As the title of the blog may suggest, I intend to have this blog discuss the relationship between the changing climate and how it can negatively affect our health. The first topic being discussed is related to air pollution. The climate is changing which can affect the movement of weather systems, humidity, amount of clouds in the sky, temperature, and even how the wind flows. This in turn plays a role in air pollution, more specifically with the amounts and location of the pollutants. The same meteorological processes that are affected by the changing climate are also responsible for transporting various pollutants hundreds to thousands of miles away. So just because a pollutant was produced in one area does not mean that it will only effect that specific area. The pollutants are created through both natural and anthropogenic (human induced) means. There is no one source that is responsible for the creation of the six pollutants. They are however created from sources that are identified as being natural, from a specific area, from a stationary source, and from a mobile source. Possible examples of natural sources are lightning, wildfires/forest fires, volcanoes, and dust storms. Sources from a specific area are places like a city scene. Sources of a stationary location are those areas like various plants or treatment centers. Lastly, the sources which are mobile consist of cars, trucks, and buses.

Image result for air pollutant

          The main pollutants contributing to the air pollution include CO, NO2, SO2, O3, Lead, and particulate matter (further categorized by its size as 2.5µm and 10µm). Overall, these pollutants can cause such health problems as cardiovascular illnesses, respiratory illnesses, headaches, fatigue, and nausea to name a few. However, each pollutant is capable of causing health effects that are specific to that substance, due to how it distinctively affects the human body. Carbon monoxide (CO) will bind to the hemoglobin present in the blood. As a result, the blood cannot transport the blood as well as it normally could. This will then cause the body’s tissues and organs to not receive the appropriate amount of oxygen. Nitrogen dioxide (NO2) tends to inflame the lining of the lungs, causing the individual to have a decreased immunity related to respiratory illnesses or infections. Sodium dioxide (SO2) will irritate the nose, throat, and airways leading to the lungs as soon as it is inhaled. Ozone (O3) can be found in the upper atmosphere as well as at the ground level. It is this ground level ozone that has the most potential for undesired adverse reactions. Like Sodium dioxide, ozone will also irritate the nose, throat, and airways leading to the lungs. Lead (Pb) has a mechanism that is slightly different than the other pollutants. Once lead has been absorbed into the body, the bloodstream will transport it throughout the body. Once it reaches the bones, it will then become deposited into the bones. Lead is a substance that will only be expelled in small amounts. This means that if there is continued exposure to lead, the person may reach levels of toxicity. Lastly is particulate matter (PM2.5 and PM10) which describes a mixture of various chemicals. This particulates can be especially dangerous because once inhaled, then are then capable of lodging themselves with the lung tissue. No matter the pollutant or how it will precisely impact a person’s body, all of the pollutants pose as a threat to anyone who may be healthy or who has a more complex health history.

Image result for predisposed

          The pollutants can pose more of a threat in feeling the effects of air pollution whenever a person has a medical disease that causes them to be predisposed. These people may be predisposed for different reasons, but still may require special precautions whenever the levels of the pollutants may be increased. With each pollutant, the individuals who are most are risk may vary slightly, but they do remain fairly consistent throughout. The various people include unborn babies, infants, children, the elderly, people with anemia, and people that have a history of a respiratory or heart disease. It is very important that these people should be especially aware of the standard values for each pollutant, as well as the level for the pollutants for their area. The standard air pollutants values can be located from the national agency assigned to monitoring air quality.


The following table was composed to display more specific signs and symptoms that is related to each pollutant.

Pollutant Signs and Symptoms
 

CO

Image result for carbon monoxide

·         Trouble concentrating

·         May be clumsy, or have a lack of coordination

·         May easily become tired

·         If high enough amount is absorbed, may lead to death

·         People with heart problems have the risk of more frequent and longer angina, which then creates an increased risk for a myocardial infarction (heart attack)


NO2

Image result for nitrous dioxide

·         Respiratory problems

·         Wheezing

·         Coughing

·         Increased risk for colds

·         Increased risk for the flu

·         Increased risk for bronchitis

·         Increased frequency of asthmatic attacks


SO2

Image result for sulfur dioxide

·         Coughing

·         Wheezing

·         Shortness of breath

·         Feeling of chest tightness

·         Increased risk of mortality

·         Visibility impairment


O3

Image result for ground level ozone

·         Coughing

·         Feeling of chest tightness

·         Increased frequency of asthmatic attacks


Lead

Image result for lead

·         May lead to brain damage or mental retardation (in children)

·         Behavioral problems (in children)

·         Anemia (in children)

·         Liver (in children)

·         Kidney damage (in children)

·         High blood pressure (in adults)

·         Kidney disease (in adults)

·         Digestive problems (in adults)

·         Nerve disorders(in adults)

·         Memory and concentration problems )in adults)

·         Muscle and joint pain (in adults)


PM2.5 and PM10

Image result for particulate

·         Respiratory illnesses (like asthma and bronchitis)

·         Cardiovascular disease

·         Some particulates may even cause cancer

·         Premature mortality


Closing Remarks

I hope that you have found this post to informative and maybe even got you thinking about how many different may be connected. I would love to hear everyone’s thoughts and opinions, so feel free to leave a comment. Thanks everyone for reading.


Credit that is Due

Credit should always be given when and wherever it is due. The following sources were used in order to compose this blog entry.


Arb.ca.gov. (2018). Carbon Monoxide and Health. [online] Available at: https://www.arb.ca.gov/research/aaqs/common-pollutants/co/co.htm [Accessed 12 Feb. 2018].

Arb.ca.gov. (2018). Inhalable Particulate Matter and Health. [online] Available at: https://www.arb.ca.gov/research/aaqs/common-pollutants/pm/pm.htm [Accessed 12 Feb. 2018].

Arb.ca.gov. (2018). Lead and Health. [online] Available at: https://www.arb.ca.gov/research/aaqs/common-pollutants/pb/pb.htm [Accessed 12 Feb. 2018].

Arb.ca.gov. (2018). Nitrogen Dioxide and Health. [online] Available at: https://www.arb.ca.gov/research/aaqs/common-pollutants/no2/no2.htm [Accessed 12 Feb. 2018].

Arb.ca.gov. (2018). Ozone and Health. [online] Available at: https://www.arb.ca.gov/research/aaqs/common-pollutants/ozone/ozone.htm [Accessed 12 Feb. 2018].

Arb.ca.gov. (2018). Sulfur Dioxide and Health. [online] Available at: https://www.arb.ca.gov/research/aaqs/common-pollutants/so2/so2.htm [Accessed 12 Feb. 2018].

Conserve Energy Future. (2018). Sources and Effects of Six Common Air Pollutants – Conserve Energy Future. [online] Available at: https://www.conserve-energy-future.com/sources-and-effects-of-six-common-air-pollutants.php [Accessed 12 Feb. 2018].

Kassulke, N. (2018). The six principal pollutants — Wisconsin Natural Resources magazine — December 2004. [online] Dnr.wi.gov. Available at: http://dnr.wi.gov/wnrmag/html/supps/2004/dec04/six.htm [Accessed 12 Feb. 2018].

Department of the Environment and Energy. (2018). Department of the Environment and Energy. [online] Available at: http://www.environment.gov.au/protection/publications/factsheet-carbon-monoxide-co [Accessed 12 Feb. 2018].

Department of the Environment and Energy. (2018). Department of the Environment and Energy. [online] Available at: http://www.environment.gov.au/protection/publications/factsheet-sulfur-dioxide-so2 [Accessed 12 Feb. 2018].

Department of the Environment and Energy. (2018). Department of the Environment and Energy. [online] Available at: http://www.environment.gov.au/protection/publications/factsheet-nitrogen-dioxide-no2 [Accessed 12 Feb. 2018].

Department of the Environment and Energy. (2018). Department of the Environment and Energy. [online] Available at: http://www.environment.gov.au/protection/publications/factsheet-ground-level-ozone-o3 [Accessed 12 Feb. 2018].

Department of the Environment and Energy. (2018). Department of the Environment and Energy. [online] Available at: http://www.environment.gov.au/resource/particles [Accessed 12 Feb. 2018].

Department of the Environment and Energy. (2018). Department of the Environment and Energy. [online] Available at: http://www.environment.gov.au/protection/publications [Accessed 12 Feb. 2018].